A big part of Parsons’ business is to analyze and manage risks. Risks can come from any direction and in any form. Without a system that can track and study these risks, the consequences can be dangerous. ParRisk is a software that is designed to do just that. My role for this project is primary developer and UX engineer.
In a nutshell, a user can use this system to enter the risks involved in a project. They will have the ability to add taxonomies, notes as well as add a value to each risk.
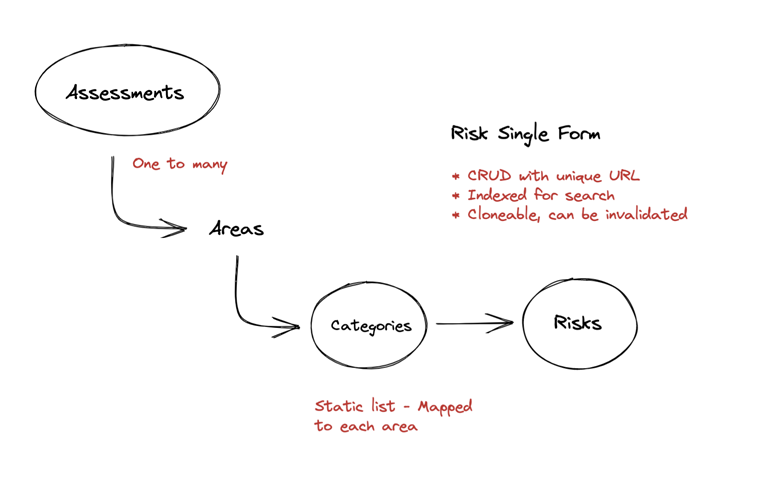
Each risk is project based. Many risks can be assigned to a single project, although risk information can be shared between multiple projects. A custom taxonomy relationship had to be built to support this design. Additional functionality such as archiving, cloning, escalation and flags are all baked in to the system as well.
Creating / Updating Risks
One of the unique features of the application is the risk entry form. The form itself sits inside a modal – that appears right on top of the grid. This allows users fast and easy access to more details about the risk, as well as adjust the underlying data.
Below shows a simplified wireframe of the risk form + data row.
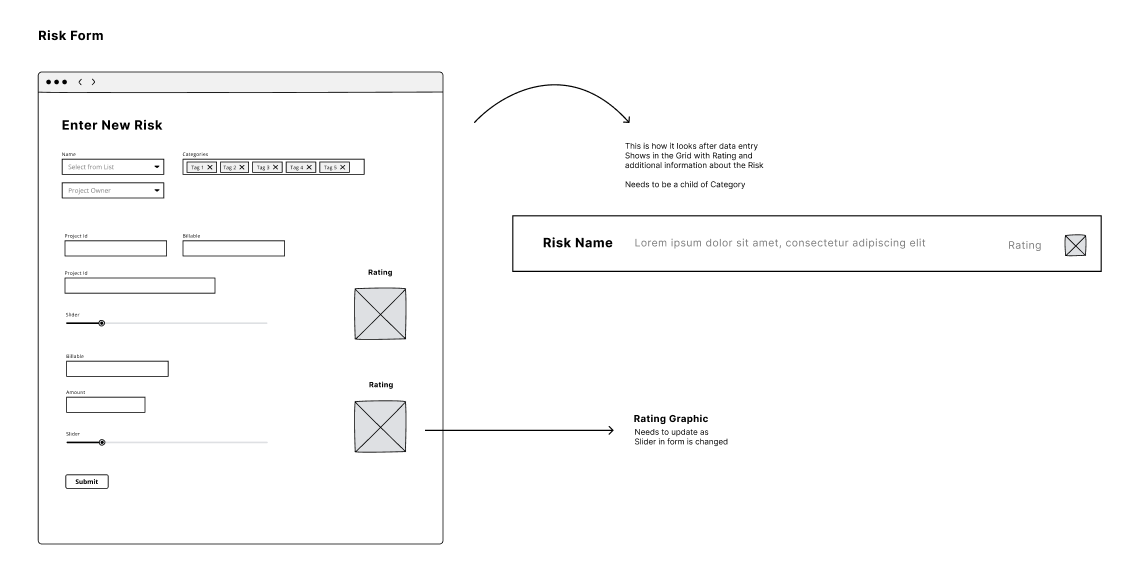
The animation below shows the part of the form with custom sliders. When the sliders are changed, the rating graphic gets updated. This unified graphic approach gives users a quick sense of how each risk should be evaluated.
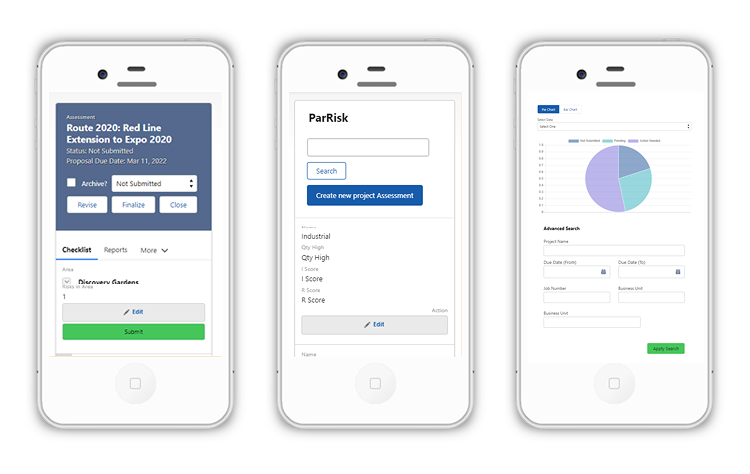
Another unique feature of the application is a quick overview of the assessments that are in the system. A couple of chart options give the viewer a general scenario of how many assessments need action.
An advanced search form as well as filter options is also added for users find their assessments easily.
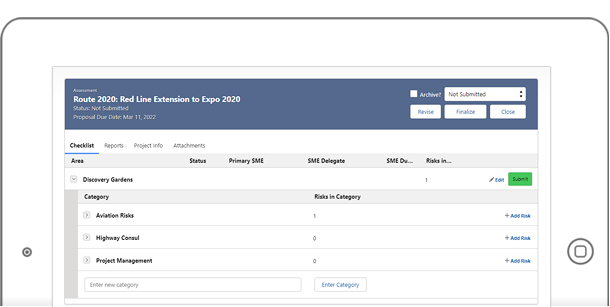
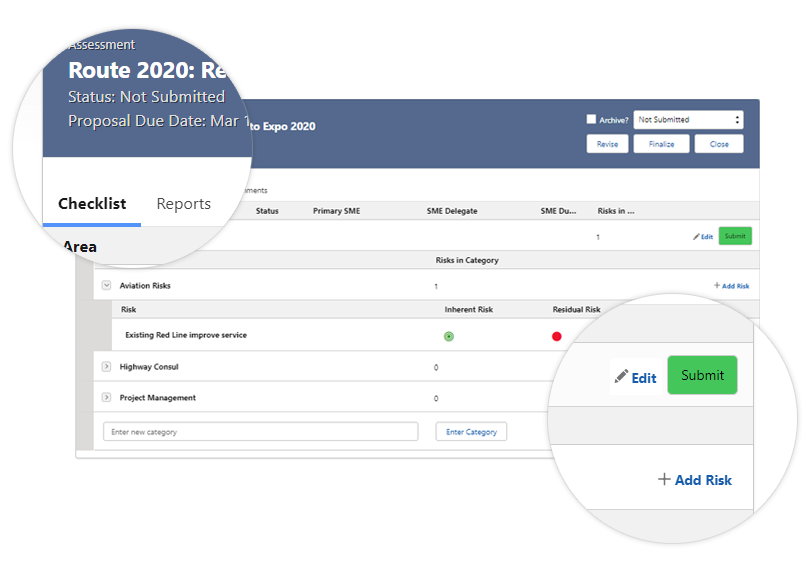
The Dashboard / Grid
One of the main features of ParRisk is the Grid. The grid basically shows a project – along with the corresponding elements that go with it. This includes the areas and categories that can be expanded and collapsed. Inline editing is enabled, so users do not have to jump from one modal to another, just to update information that is already present in the grid.
Tabbed navigation is added to give users a fast way to switch views. This includes access to project information, attachments and reporting.
The real meat of the grid are the risks. Each risk row shows the graphic I mentioned above (inherent and residual risks). The algorithm for determining this graphic is stored in custom metadata – so it can be adjusted easily, without having to update the source code.
In addition to the desktop view, it also has to be render good in mobile devices.
The application architecture is single page, with routes that determine records, forms as well as filters and search options. We use a library called “Aura”, which is template based JavaScript framework. The backend is stored in Salesforce, along with external modules such as ChartJS for the charts.
The project took a little over two months to build. Additions such as automated notifications, batch processing and scheduled jobs were implemented.
Overall, ParRisk was a huge success. It received a lot of recognition, along with many happy users using the tool on a daily basis.