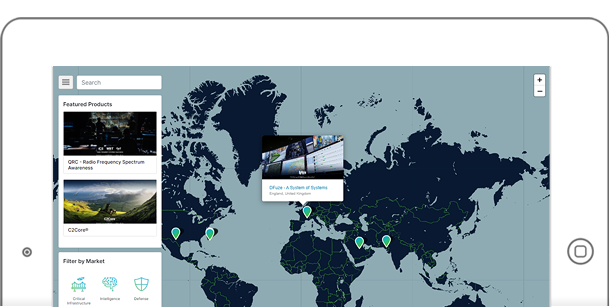
Our Enterprise marketing group had come up with an idea of having a presentation tool to use in conferences and meetups. They were thinking of an interface that shows the company projects and installments throughout the globe. An interactive map, that have pins and markers that when clicked, shows more information about that project. They also wanted something that they can easily update and ultimately tailor to each event. They wanted to call it “Virtual World“.
My role for this project is Lead Developer. The project was done in React and WordPress.
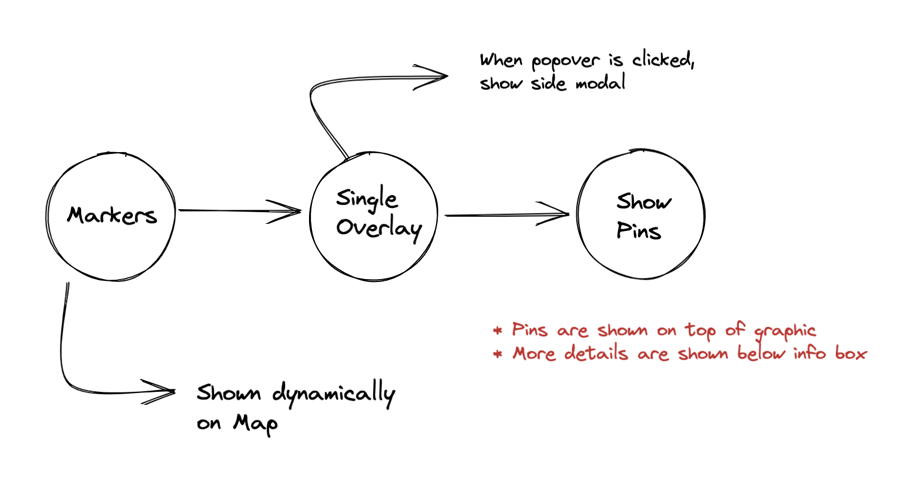
The basic functionality is shown in this diagram:
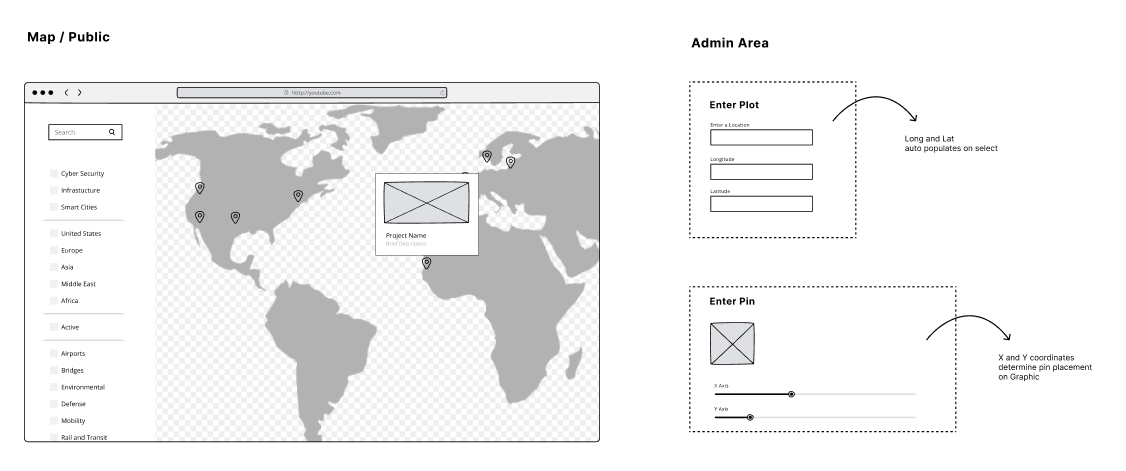
Several rounds of wireframes and prototypes were done in Figma. A quick representation is shown below.
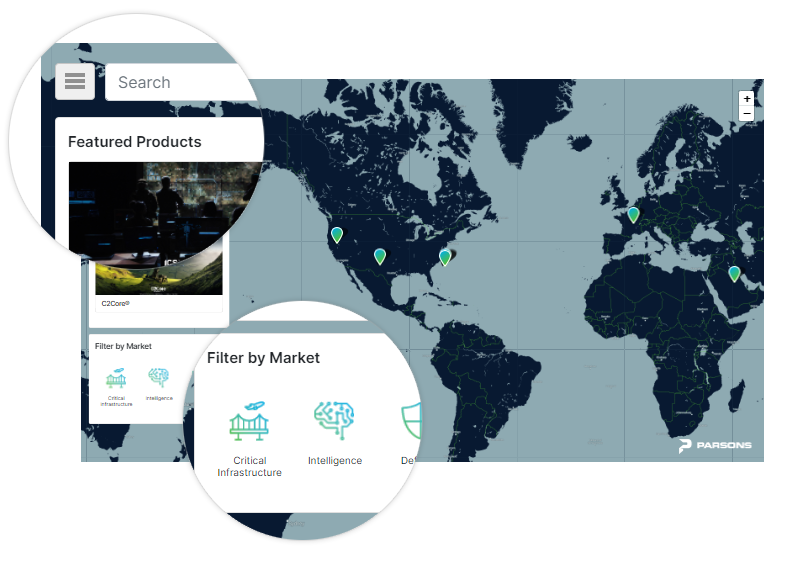
The public side of the application is a map. I used Leaflet for the map technology, along with Mapbox for the map styling. All interactions happen as layers on top of the map – either as modals or sliding sidebars. And since the application is wrapped inside our existing WordPress site, it had to use Bootstrap because it was already loaded on the page.
The company branding had to reflect in the map elements. This includes typography, icons, images, markers and backgrounds.
Plotting Locations
So for the markers on the map, I created a custom post type that can be entered in the admin area. For each record, I had to provide an easy way for the locations to pull up, as well as plot the coordinates automatically. A little help from Google Places API did the trick.
The users simply add an address and the API would come back with suggestions. The coordinates that is required for the marker placement is handled upon selecting a valid address.
Highlighting Parts of an Image
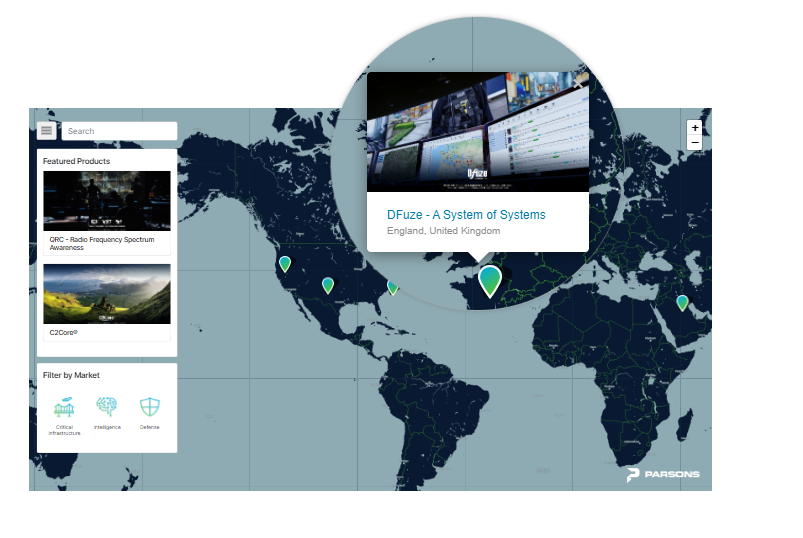
So as soon as a product marker is clicked, a side modal appears on the right side of the page. This includes more information about the product. In most cases, a hero image is presented along with marked sections highlighting key functionalities of the product.
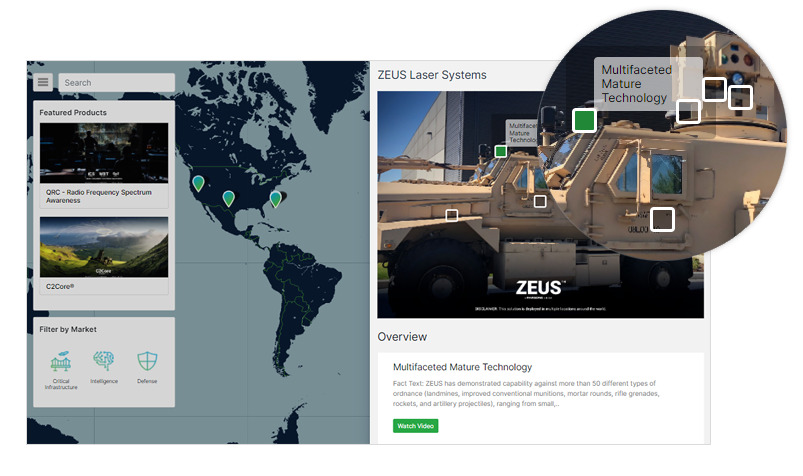
This is done using CSS Positioning on the actual image. In the backend, users simply estimate the coordinates on where they want the pin to appear. This is done using input sliders.
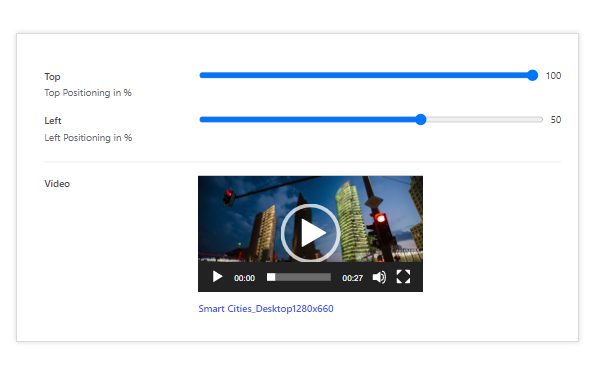
All of this done using custom meta boxes, mainly using jQuery and HTML in the WordPress admin area.
Search and Filters
In addition to the map, there is also the ability to filter the pins. This allows the presenter, to only focus on a pre-defined set of projects.
The search mechanism is a simple text match query. The term looks inside the title, category and description – which sort of acts like a filter as well. There is an additional “Advanced Market filter” sidebar, which I thought was redundant. It’s also a set of filters, but instead of icons, checkboxes with labels are used.
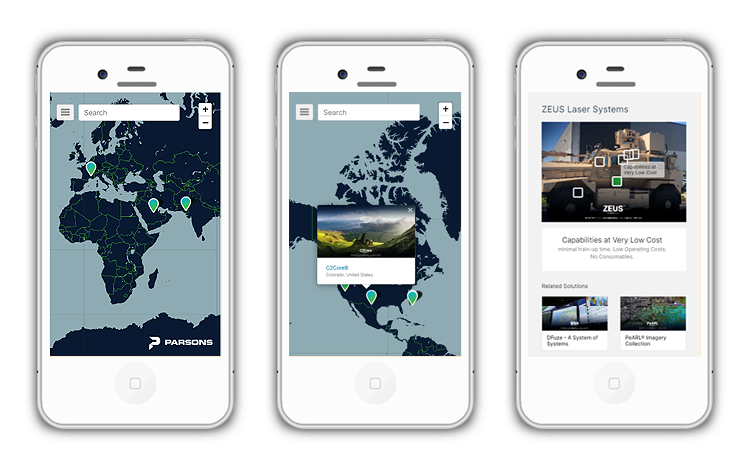
Finally, although really designed for wider screens – I had to make it “semi” usable in mobile devices. The map responds to smaller screens pretty well. Although there’s not much we can do as far as presenting both the map and the overlays at the same time.
In the end, the sidebars and modals simply take up the entire screen, giving the user an option to close it.
Using a framework like React as well as JavaScript modules is pretty remarkable. This ultimately allows developers to build a fairly complicated application, with just a few lines of code.
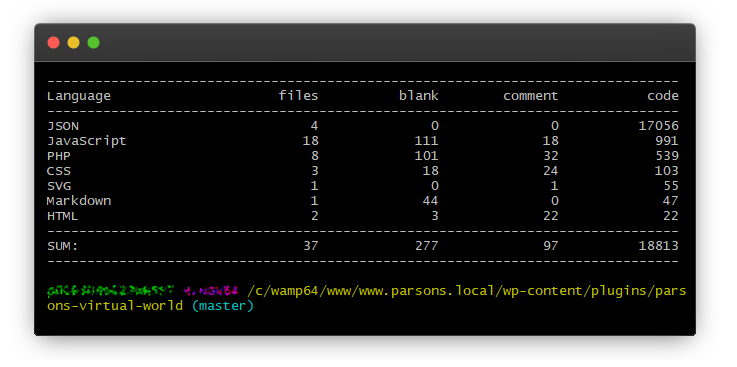
Virtual world took approximately two weeks to build. The project was delivered to the owner, with just enough time for users to enter data and get trained on how to present the front end. Continuous improvements are still being implemented to this day.